How to install ELK stack on Ubuntu 20.04
Last updated on March 23, 2021 by Alfonso Silva
When many different services and applications are deployed across multiple servers, pulling all their logs and drawing meaningful operational insights from them are not an easy task. That is where the ELK stack comes to the rescue. When properly deployed and configured, the ELK platform allows you to consolidate, process, monitor and perform analytics on data generated from multiple sources in a way that is fast, scalable and reliable.
In this tutorial, you will learn how to configure the ELK stack on Ubuntu 20.04 platform. Before delving into the topic, let's first find out what the ELK stack is and what problems it can solve.
What is the ELK Stack and Why Use It?
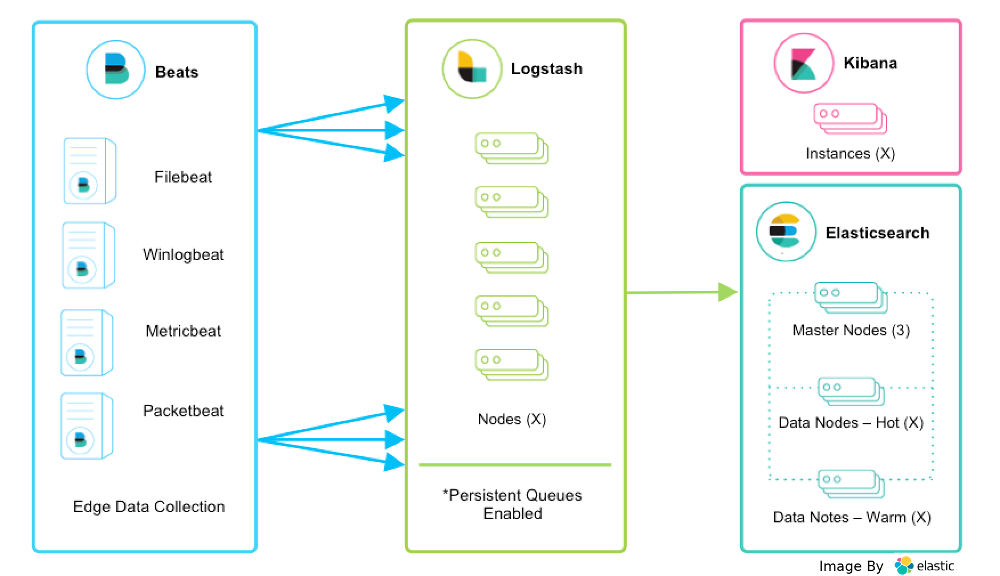
As a powerful, production-grade log analysis platform, the ELK stack comprises three free open-source software: Elasticsearch, Logstash, and Kibana, and hence the acronym. Each of these software components plays a distinct role in log analysis.
- Elasticsearch: a search engine that can store and search text-based data using distributed sharded storage. This is the heart of the whole stack.
- Logstash: a data processing component that collects, parses, and transforms data before shipping it to Elasticsearch for storage.
- Kibana: a web-based data visualization dashboard that provides interfaces by which you can explore and run analytics on collected data.
Another open-source tool that is often talked about with the ELK stack is Beats. Beats are lightweight transport agents whose sole purpose is to collect application data from servers and send it to Elasticsearch or Logstash. Different types of Beats are available, depending on the types of data being shipped. In this post, we will be using Filebeat which was created mainly to read log files.
With ELK, you will be able to collect, search, analyze and visualize application log data from one centralized location. The stack can handle different types of data with a flexible data processing pipeline. It can handle large amounts of data efficiently and scalably by distributing data in a cluster of storage nodes. Once processed and stored, the data can be made available for inspection and analysis by domain experts in fully customizable dashboards.
You can deploy each element of the ELK stack separately on one more more servers, and can scale each element as needed by adding more servers. In a typical production environment, deployment of the ELK stack is often coordinated by Kubernetes.
Install ELK Stack on Ubuntu 20.04
This tutorial is intended to help you get started with the ELK stack. This guide is not intended for a production-level distributed ELK deployment. Here you will learn how to install each of these ELK components and how to make them work on a single Ubuntu 20.04 server. This single deployment server guide can be your starting point before you venture into a full-blown distributed ELK stack deployment down the road.
I assume that you have a Ubuntu server with 4Gb of RAM and at least 2 CPU cores of processor. Also, you need to have a valid hostname to access the Kibana web interface.
First Step: Install Necessary Packages
First of all, update the distribution by running:
$ sudo apt update
$ sudo apt upgrade
Next proceed to install basic tools that are needed for the ELK installation:
$ sudo apt install wget apt-transport-https curl gnupg2
As Elasticsearch and some of its components are written in Java, you need to install JDK. We will be using OpenJDK version 11.
$ sudo apt install openjdk-11-jdk
Check out it has been installed correctly:
$ java -version
openjdk version "11.0.10" 2021-01-19
OpenJDK Runtime Environment (build 11.0.10+9-Ubuntu-0ubuntu1.20.04)
OpenJDK 64-Bit Server VM (build 11.0.10+9-Ubuntu-0ubuntu1.20.04, mixed mode, sharing)
Now the system is ready to start the installation process.
Second Step: Add the Elasticsearch Repository
The ELK stack components are not found in the official Ubuntu repositories so you have to add an external repository provided by Elastic, which is the company behind the ELK stack. This repository allows you to easily install and update all ELK components on Ubuntu environment.
First, download and add the GPG key from the repository.
$ wget -qO - https://artifacts.elastic.co/GPG-KEY-elasticsearch | sudo apt-key add -
Next, add the repository to the system source list with the following command:
$ echo "deb https://artifacts.elastic.co/packages/7.x/apt stable main" | sudo tee -a /etc/apt/sources.list.d/elastic-7.x.list
As you can see, we are using the 7.x branch of ElasticSearch which has proven to be stable and robust. All other ELK components must be from the same branch.
Update the package lists from the new repository:
$ sudo apt update
Third Step: Install Elasticsearch
You can install Elasticsearch simply by running:
$ sudo apt install elasticsearch
By default, a new systemd service for Elasticsearch service is created but does not get started. You can start the service as well as enable auto-start with:
$ sudo systemctl start elasticsearch
$ sudo systemctl enable elasticsearch
Synchronizing state of elasticsearch.service with SysV service script with /lib/systemd/systemd-sysv-install.
Executing: /lib/systemd/systemd/systemd-sysv-install enable elasticsearch
Created symlink /etc/systemd/system/multi-user.target.wants/elasticsearch.service → /lib/systemd/system/elasticsearch.service.
You can check the status of the service with the command:
$ sudo systemctl status elasticsearch
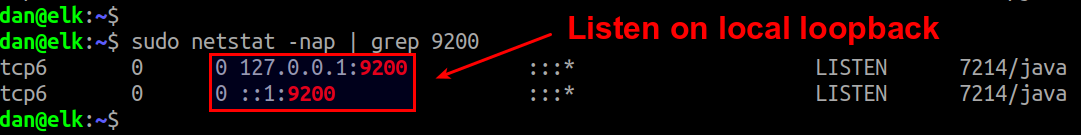
Another way to check if Elasticsearch is running is to use the curl command to send a request to localhost on port 9200.
$ curl -X GET "localhost:9200"
If successful, you will see the output:
{
  "name" : "xmodulo",
  "cluster_name" : "elasticsearch",
  "cluster_uuid" : "q85s5ZOmQbeZYj4pxdV1VQ",
  "version" : {
    "number" : "7.11.2",
    "build_flavor" : "default",
    "build_type" : "deb",
    "build_hash" : "3e5a16cfec50876d20ea77b075070932c6464c7d",
    "build_date" : "2021-03-06T05:54:38.141101Z",
    "build_snapshot" : false,
    "lucene_version" : "8.7.0",
    "minimum_wire_compatibility_version" : "6.8.0",
    "minimum_index_compatibility_version" : "6.0.0-beta1"
  },
  "tagline" : "You Know, for Search"
}
By default, Elasticsearch listens on the local loopback address at TCP port 9200, thus only accessible on localhost. This is not a problem when the ELK stack is provisioned on a single development server, as assumed in this tutorial.
Fourth Step: Install and Configure Kibana
Kibana is an open-source dashboard that allows you to visualize and explore data indexed in ElasticSearch, all through a well-designed web interface. Once Elasticsearch is installed and correctly configured, you can install Kibana with:
$ sudo apt install kibana
After installation, a new systemd service will be created with which you can start, restart, stop or check the status of Kibana.
You can start the Kibana service by running:
$ sudo systemctl start kibana
Make Kibana automatically start upon boot with:
$ sudo systemctl enable kibana
Synchronizing state of kibana.service with SysV service script with /lib/systemd/systemd-sysv-install.
Executing: /lib/systemd/systemd/systemd-sysv-install enable kibana
Created symlink /etc/systemd/system/multi-user.target.wants/kibana.service → /etc/systemd/system/kibana.service.
Kibana provides a web interface that can be secured with a reverse proxy and HTTPS. While optional, this step will further secure the ELK stack installation.
For the reverse proxy, install Nginx from the official Ubuntu 20.04 repositories.
$ sudo apt install nginx
Then create a new server block to set up the reverse proxy for Kibana. The name of the file can be whatever you want but it should be a descriptive one.
Create the following file:
$ sudo nano /etc/nginx/sites-available/mydomain.com
With content:
server {
    listen 80;
    server_name your_domain;
    location / {
        proxy_pass http://localhost:5601;
        proxy_http_version 1.1;
        proxy_set_header Upgrade $http_upgrade;
        proxy_set_header Connection 'upgrade';
        proxy_set_header Host $host;
        proxy_cache_bypass $http_upgrade;
    }
}
Replace the your_domain with a fully qualified domain name of the server (e.g., www.mydomain.com).
After this, enable the server block with:
$ sudo ln -s /etc/nginx/sites-available/mydomain.com /etc/nginx/sites-enabled/mydomain.com
Next, obtain a certificate from Let's Encrypt using the certbot tool. For this, first install Certbot and the Nginx plugin:
$ sudo apt install certbot python3-certbot-nginx
Then obtain the Let's Encrypt certificate with the following command:
$ sudo certbot --redirect --hsts --staple-ocsp --agree-tos --email your-email --nginx -d your_domain
For the command to work, it is necessary to supply a valid email address and domain name with --email and -d options.
Since the Nginx will be handling external traffic for Kibana, don't forget to open the Nginx ports in the firewall:
$ sudo ufw allow 'Nginx Full'
Finally, restart Nginx:
$ sudo systemctl reload nginx
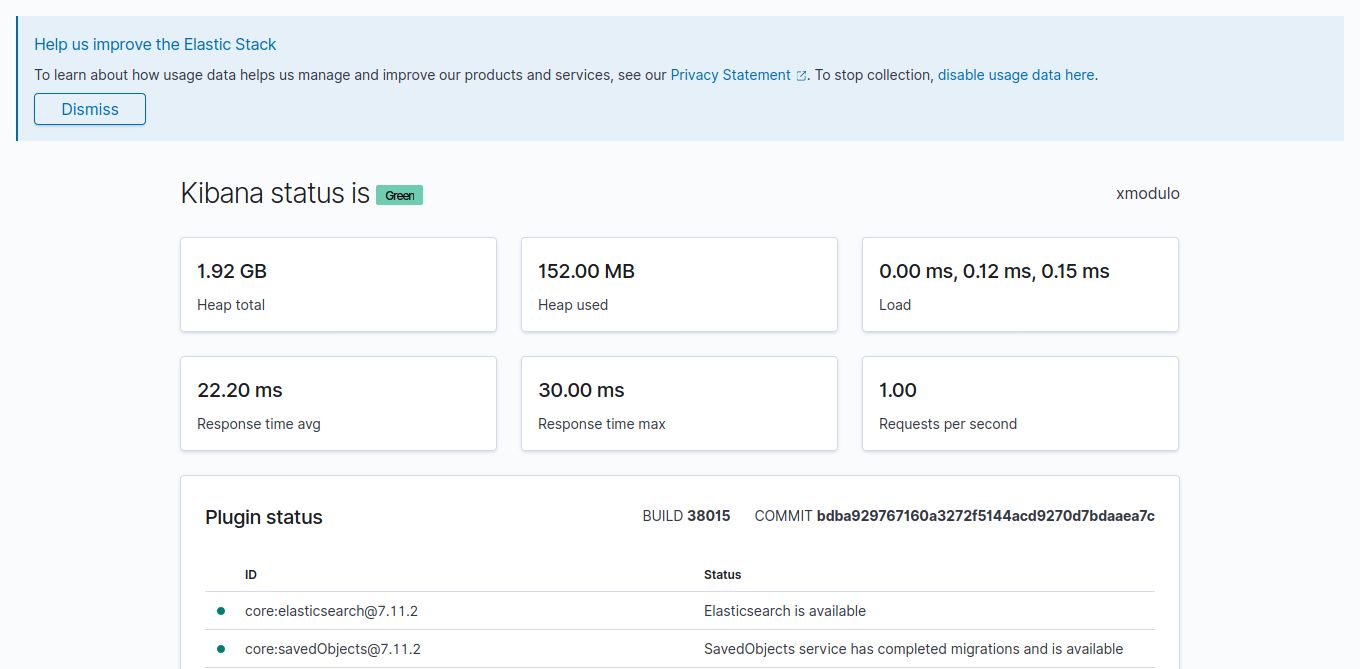
At this point, you should be able to access Kiban at https://your_domain/status from an external computer.
Fifth Step: Install and Configure Logstash
This component of the ELK stack allows consolidating log data from multiple sources, transforming the data, and redistributing it. Although Logstash can be deployed as a standalone log processing tool, it is more commonly integrated in the feature-rich ELK stack.
Thanks to the Elastic repository, installation of Logstash is as easy as running:
$ sudo apt install logstash
The default configuration of Logstash is found in /etc/logstash/conf.d.
The first thing to do after installing Logstash is to configure a processing pipeline in this configuration directory. In the following example, we are configuring a very simple pipeline consisting of an input (data source) and an output (data sink) without any transformation/filtering inbetween.
First, configure a Filebeat input for Logstash, such that the Filebeat will transfer collected data to Logstash on port 5044. For this, create the following file.
$ sudo nano /etc/logstash/conf.d/02-beats-input.conf
input {
  beats {
    port => 5044
  }
}
Next, create another configuration file to define an output to Elasticsearch.
$ sudo nano /etc/logstash/conf.d/30-elasticsearch-output.conf
And add the following content:
output {
  if [@metadata][pipeline] {
    elasticsearch {
    hosts => ["localhost:9200"]
    manage_template => false
    index => "%{[@metadata][beat]}-%{[@metadata][version]}-%{+YYYY.MM.dd}"
    pipeline => "%{[@metadata][pipeline]}"
    }
  } else {
    elasticsearch {
    hosts => ["localhost:9200"]
    manage_template => false
    index => "%{[@metadata][beat]}-%{[@metadata][version]}-%{+YYYY.MM.dd}"
    }
  }
}
This configuration means that Logstash will stores data sent by the Filebeat in Elasticsearch which is running on localhost:9200.
You can check the syntax of configurations you have created for any errors:
$ sudo -u logstash /usr/share/logstash/bin/logstash --path.settings /etc/logstash -t
If everything is okay, you will see the following output:
Configuration OK
Finally, start the Logstash service and get it automatically started with the system:
$ sudo systemctl start logstash
$ sudo systemctl enable logstash
Sixth Step: Configuring Filebeat
Filebeat is one of the most popular Beats among ELK stack users, which is designed to read large amount of files. Its most common use case is to collect log data and ship it to Logstash or Elasticsearch for storing and indexing.
You can install it by running:
$ sudo apt install filebeat
The configuration file for Filebeat is found in /etc/filebeat/filebeat/filebeat.yml.
Open the file with a text editor:
$ sudo nano /etc/filebeat/filebeat.yml
Comment out the lines where it directs the output to Elasticsearch.
...
#output.elasticsearch:
  # Array of hosts to connect to.
  #hosts: ["localhost:9200"]
...
And uncomment the one referring to Logstash:
output.logstash:
  # The Logstash hosts
  hosts: ["localhost:5044"]
What you are doing with this configuration is redirecting the data to Logstash instead of Elasticsearch. This makes it possible to reduce the sending rate in cases of saturation in Elasticsearch and to make better use of Logstash.
Next, enable the Filebeat system modules.
$ sudo filebeat modules enable system
Then load the Filebeat data parsing process.
$ sudo filebeat setup --pipelines --modules system
Now load the Filebeat data indexing template.
$ sudo filebeat setup --index-management -E output.logstash.enabled=false -E 'output.elasticsearch.hosts=["localhost:9200"]'.
Index setup finished.
If you want to improve the integration of Filebeat with Kibana, it is necessary to activate the panel in the graphical interface. To do this, disable the Logstash output and enable the Elasticsearch output:
$ sudo filebeat setup -E output.logstash.enabled=false -E output.elasticsearch.hosts=['localhost:9200'] -E setup.kibana.host=localhost:5601
And to apply the changes, start the Filebeat service and make it auto-start with the system.
$ sudo systemctl start filebeat
$ sudo systemctl enable filebeat
Now it remains to explore all that Kibana offers and take advantage of the tool.
Conclusion
The ELK stack has proven to be a very useful solution in many production environments where sophisticated searches and analytics are required on a massive amount of distributed log data. Hopefully this tutorial is a good starting point for you to explore the full potential of this versatile log analysis platform.Support Xmodulo
This website is made possible by minimal ads and your gracious donation via PayPal or credit card
Please note that this article is published by Xmodulo.com under a Creative Commons Attribution-ShareAlike 3.0 Unported License. If you would like to use the whole or any part of this article, you need to cite this web page at Xmodulo.com as the original source.

Xmodulo © 2021 ‒ About ‒ Write for Us ‒ Feed ‒ Powered by DigitalOcean