How to monitor disk I/O in Linux from command line
Last updated on December 10, 2020 by Dan Nanni
If your Linux system gets slow down due to heavy disk I/O activities, you probably want to know which processes or users (in case of multi-user systems) are the culprit for such activities. You may also wish to monitor disk I/O trending over time as part of daily Linux system administration. Here I will introduce several disk I/O monitoring tools on Linux.
Monitor disk I/O on per-process basis
If you want to monitor disk I/O activities of individual Linux processes, you can try iotop. This tool shows a sorted list of the most I/O intensive processes in real time via top-like interface.
Install iotop on Linux
To install iotop on Ubuntu or Debian, run the following.
$ sudo apt-get install iotop
To install iotop on Fedora, run:
$ sudo yum install iotop
To install iotop on CentOS or RHEL, first set up RepoForge repository on your system, and then use yum command.
$ sudo yum install iotop
Monitor Disk I/O with iotop
To monitor systemwide disk I/O with iotop, simply run the following:
$ sudo iotop
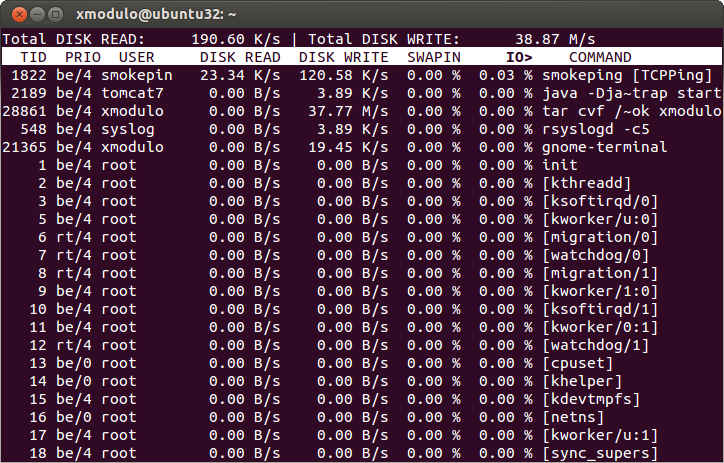
Running iotop without any argument like above shows a list of all existing processes regardless of their disk I/O activities. If you want iotop to only show processes that are actually doing disk I/O, run the following instead.
$ sudo iotop -o
Monitor disk I/O on per-disk basis
If you are interested in monitoring disk read/write rates of individual disks, you can use iostat. This tool allows you to monitor I/O statistics for each device or partition. To use this tool, you need to run sysstat package.
To install sysstat on Ubuntu or Debian:
$ sudo apt-get install sysstat
To install sysstat on CentOS, RHEL or Fedora:
$ sudo yum install sysstat
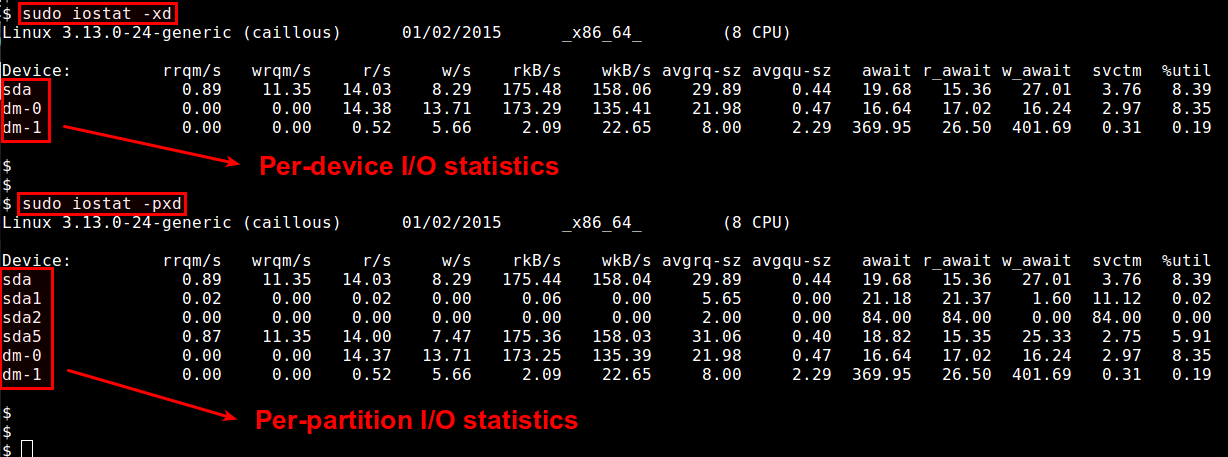
To monitor disk I/O of individual disk devices:
$ sudo iostat -xd <update interval in seconds>
The above iostat command will report per-device I/O statistics, including # of read/write requests per second (noted as r/s, w/s), average read/write speed (in KB/s), average read/write wait time (in milliseconds), average size of requests (in sectors), and percentage of CPU time spent for I/O requests. The statistics are refreshed every time interval specified.
To monitor disk I/O of individual disk partitions:
$ sudo iostat -pxd <update interval in seconds>
Support Xmodulo
This website is made possible by minimal ads and your gracious donation via PayPal or credit card
Please note that this article is published by Xmodulo.com under a Creative Commons Attribution-ShareAlike 3.0 Unported License. If you would like to use the whole or any part of this article, you need to cite this web page at Xmodulo.com as the original source.

Xmodulo © 2021 ‒ About ‒ Write for Us ‒ Feed ‒ Powered by DigitalOcean